A Quick Look at Portland Parking Ticket Data
I work in downtown Portland and see a lot of people getting parking tickets every day (parking is one of the reasons I ride my bike to work). I was curious to learn more about it.
Thanks to the Freedom of Information Act, Portland parking ticket data is available to anyone who wants it. I decided to make a request to the city, and in a few short weeks, I had my hands on a collection of nearly 1 million recorded parking tickets issued over nearly the past 4 years (2015, 2016, 2017, 2018).
The records are surprisingly complete. They contain GPS coordinates, street names, vehicle types, violation information and details of each violation. I was surprised to see that even license plates were included. I did some quick analysis of the data with pandas and I’ve reported my results below.
Worst specific places for parking tickets
Naito Parkway and SW 4th avenue downtown generate the most parking tickets which is not surprising.
| Streets | Number of Tickets |
|---|---|
| NW NAITO PKY and NW 9TH AVE | 6100 |
| SW 4TH AVE and SW YAMHILL ST | 3538 |
| SW BROADWAY and SW TAYLOR ST | 3238 |
| SW 6TH AVE and SW MAIN ST | 3170 |
| SW 4TH AVE and SW TAYLOR ST | 3141 |
| SW 4TH AVE and SW MAIN ST | 3064 |
| SW 4TH AVE and SW SALMON ST | 2901 |
| SW PARK AVE and SW SALMON ST | 2855 |
| SW 4TH AVE and SW ALDER ST | 2768 |
| NW 13TH AVE and NW EVERETT ST | 2762 |
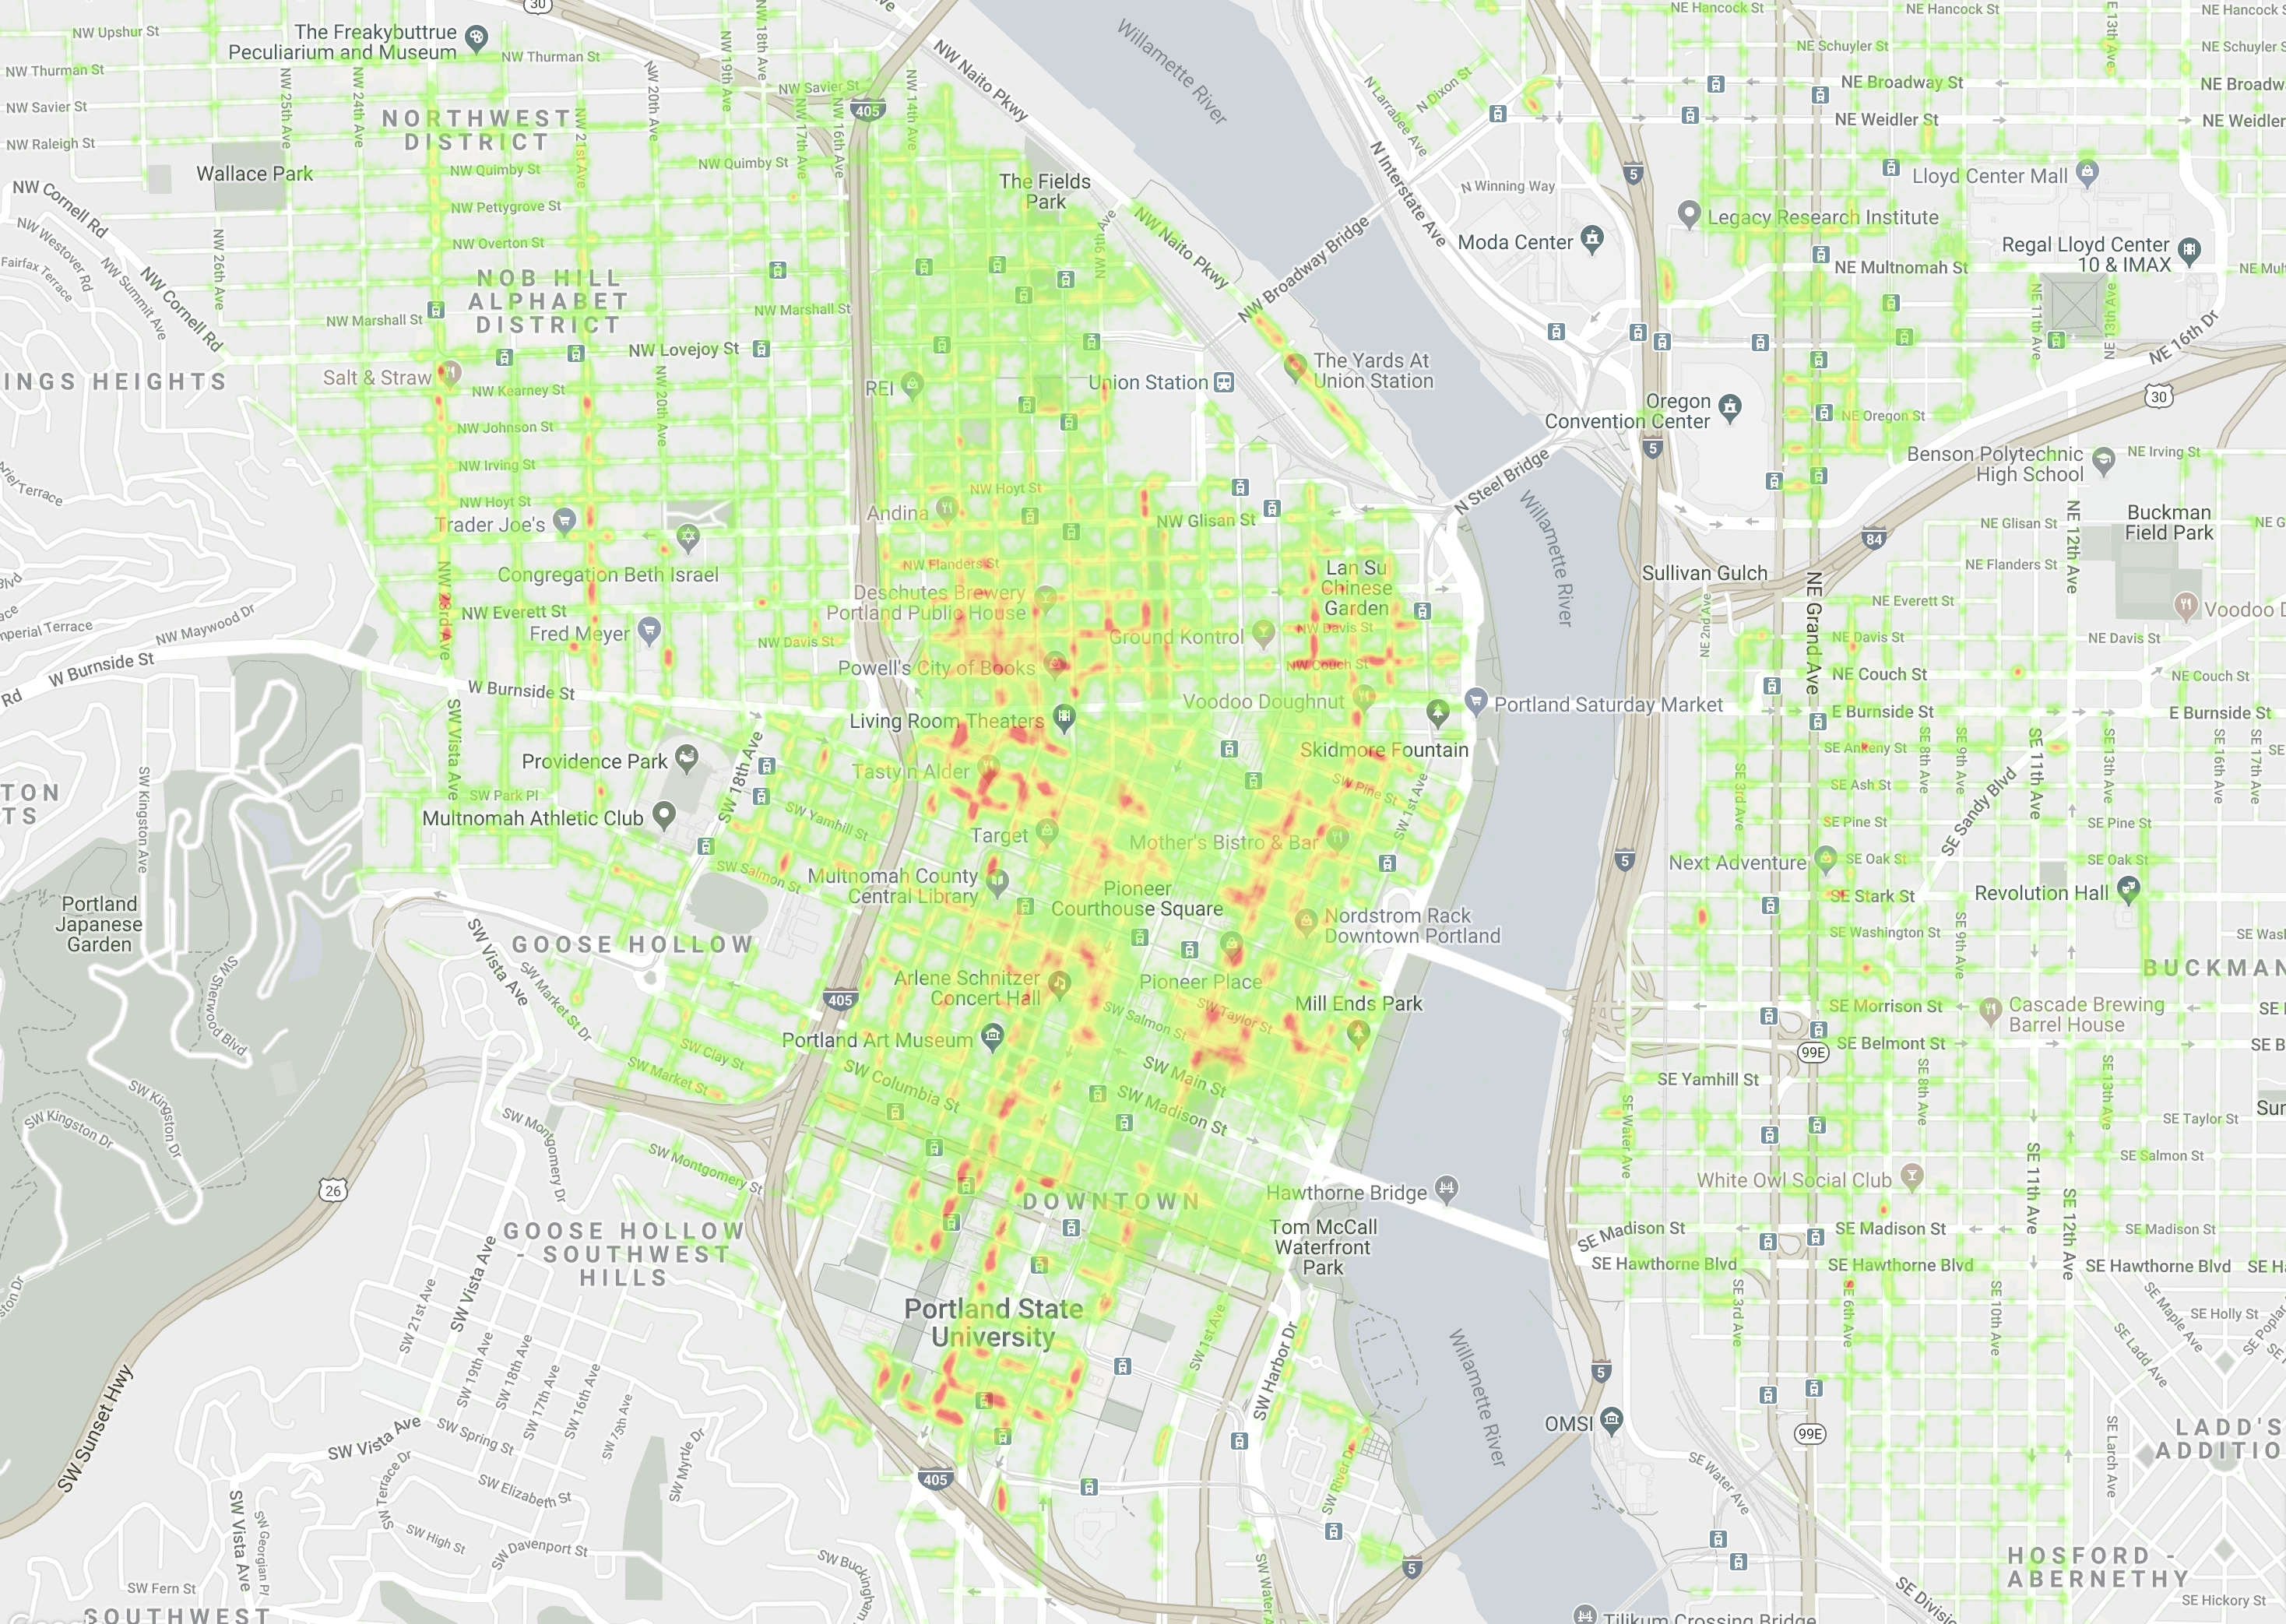
I also thought it would be interesting to put the data on a heatmap (click the image for a high-resolution version).
Highest Average Parking Tickets By Car Make
UPS and FEDEX trucks dominate the list of ticket generators. Also, Car2Go cars (Smartcar), Sterling sports cars, Kymco scooters, Winnebago RVs, high-end Maserati sedans and construction trucks (Peterbilt) are at the top of the list.
| Car Make | Average Tickets |
|---|---|
| UTILIMASTER (FEDEX/UPS) | 4.076271 |
| SMARTCAR | 3.405473 |
| STERLING | 3.161290 |
| MASERATI | 2.851852 |
| WORKHORSE (FEDEX/UPS) | 2.833333 |
| KYMCO | 2.807692 |
| WINNEBAGO | 2.669291 |
| PETERBILT | 2.511111 |
| DESOTO | 2.500000 |
| FREIGHTLINER (FEDEX/UPS) | 2.389049 |
Highest Average Tickets By Car State
For some reason, Alabama drivers have by far the most parking tickets on average. Close behind are drivers from Pennsylvania, Arkansas, and South Carolina who also seem to have a hard time with Portland parking rules.
| State | Average Tickets |
|---|---|
| Alabama | 2.237838 |
| Pennsylvania | 2.052427 |
| Arkansas | 1.954023 |
| South Carolina | 1.953704 |
| Georgia | 1.947964 |
| Oregon | 1.927479 |
| North Carolina | 1.913306 |
| Maryland | 1.904580 |
| Montana | 1.901437 |
| Texas | 1.898456 |
Worst Offenders
The car with the most parking tickets is a 2011 Toyota Camry that has had 182 tickets over the past 3 years! If you add up all their parking violations it amounts to roughly $13593.00 in parking fines.
| Number of Tickets | Car Make/Model |
|---|---|
| 182 | 2011 Toyota Camry |
| 160 | 1997 CHEVROLET GMT-400 |
| 149 | 2001 MERCEDES-BENZ S-Class |
| 144 | 2011 AUDI A4 |
| 143 | 2007 INTERNATIONAL 1652-SC (FEDEX/UPS) |
| 132 | 2006 FREIGHTLINER MT 55 Chassis (FEDEX/UPS) |
| 126 | 2001 DODGE Stratus |
| 123 | 2002 HONDA Civic |
| 116 | 2004 SUBARU Forester |
| 108 | Unknown |
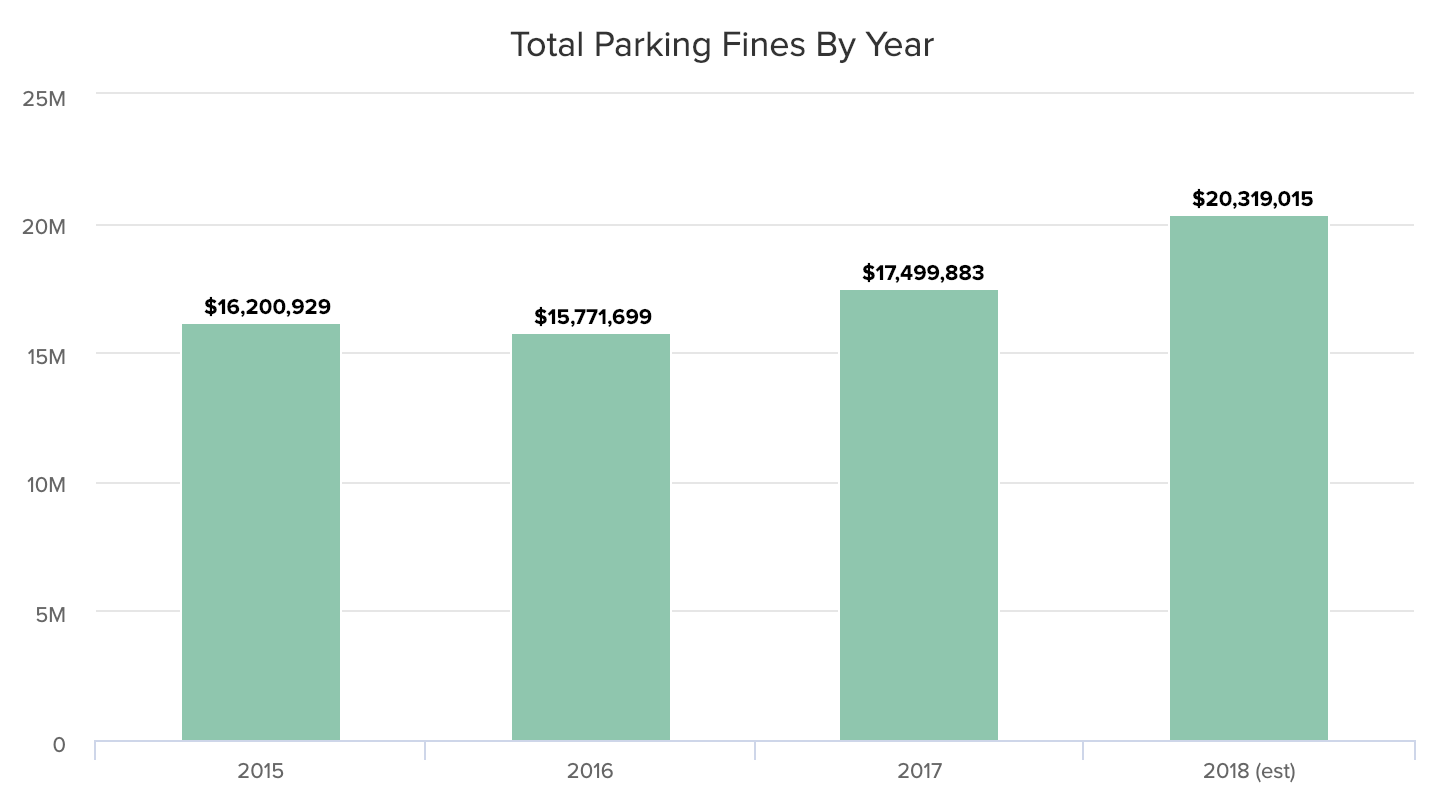
Total Parking Fines
Overall, the parking fines issued in Portland over the past 4 years seem to be increasing ($16M in 2015 to $20M in 2018). This is what you would expect given the growing population, but it’s also interesting that the average cost of a ticket has also increased pretty dramatically from $67.84 to $79.74.
| Year | Total Fines | Number of Tickets | Average Fine |
|---|---|---|---|
| 2015 | $16,200,929 | 238,797 | $67.84 |
| 2016 | $15,771,699 | 222,729 | $70.81 |
| 2017 | $17,499,883 | 219,808 | $79.61 |
| 2018 | $20,319,015 | 254,804 | $79.74 |